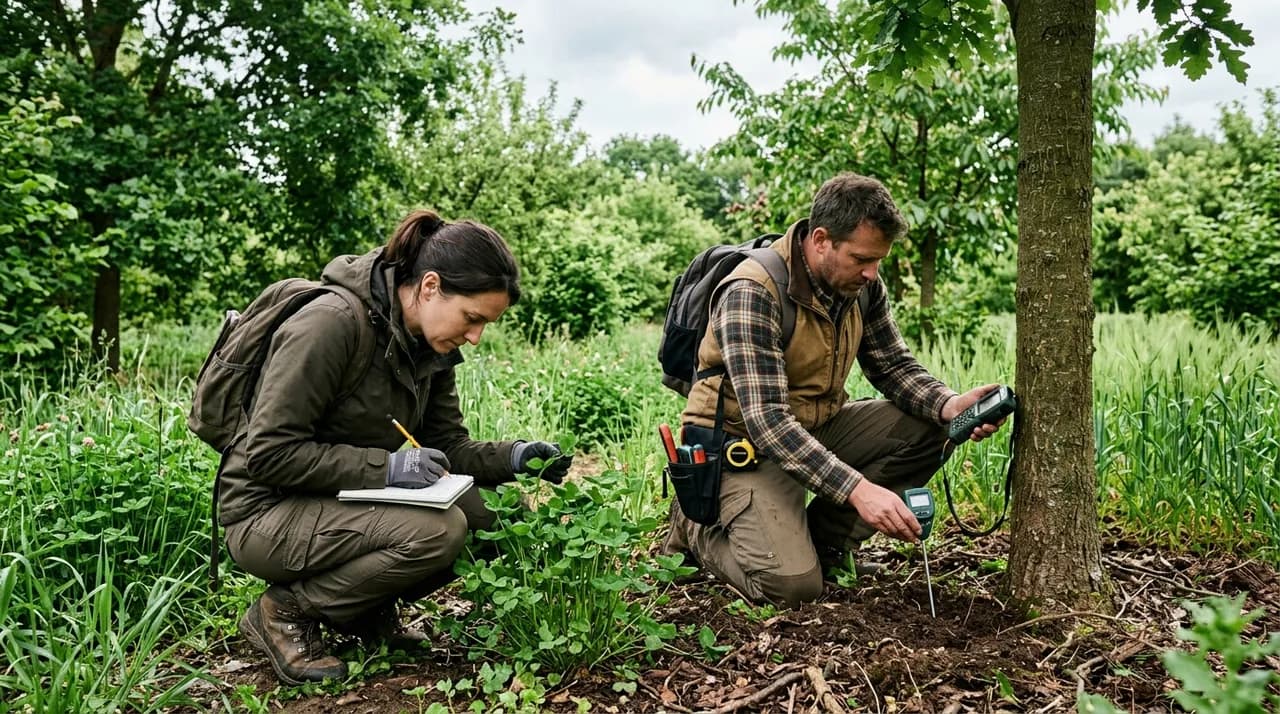
Evaluating agroforestry systems requires empirical metrics that account for spatial heterogeneity, multi-strata competition, and long-term ecological interactions across different trophic levels. Because traditional agronomic trials are designed for uniform single-species stands, agroforestry researchers employ specialized analytical frameworks, including the Land Equivalent Ratio, depth-stratified soil organic carbon stocks, and microclimatic and biodiversity indices. Understanding these metrics helps students and researchers interpret experimental literature and evaluate whether an integrated system achieves genuine resource complementarity.
When evaluating diverse types of agroforestry, researchers cannot rely on simple yield-per-hectare figures alone. Multi-species systems require holistic measurement protocols to isolate how biological components share light, water, and soil nutrients over time.
The methodological challenge of polycultural research
Conventional agricultural field trials assume environmental homogeneity across experimental plots. Standard agronomy utilizes randomized complete block designs to evaluate single variables, such as seed variety or nitrogen application, across uniform monocultures.
Agroforestry inherently violates these assumptions. Introducing woody perennials creates intentional heterogeneity across multiple physical dimensions:
- Horizontal Gradients: Microclimate, light transmission, and root density vary continuously along transects extending perpendicular from tree rows into open crop alleys.
- Vertical Stratification: Deep tree roots operate beneath shallow crop roots, while overstory canopies filter radiation before it reaches the understory.
- Temporal Divergence: Annual crops complete their life cycles within ninety to one hundred and twenty days, while companion trees mature over decades, dynamically altering plot conditions each season.
To measure these complex interactions without bias, agroforestry researchers utilize specialized indices that normalize yields, track subterranean resource flows, and quantify multi-species ecological services.
Land productivity: the Land Equivalent Ratio
The primary metric used to compare the biological productivity of an agroforestry polyculture against conventional monocultures is the Land Equivalent Ratio (LER).
``` +-------------------------------------------------------------------------------+
| LAND EQUIVALENT RATIO (LER) | +-------------------------------------------------------------------------------+
|
Yield of Crop A in Polyculture Yield of Crop B in Polyculture |
LER = --------------------------------- + ------------------------------- |
Yield of Crop A in Monoculture Yield of Crop B in Monoculture |
| | +-------------------------------------------------------------------------------+
Interpretation: |
|
|
| - LER < 1.0 : Competitive Disadvantage (Mutual suppression reduces yields) | +-------------------------------------------------------------------------------+ ```
The LER defines the relative land area required under sole cropping to produce the identical yields achieved in an integrated polyculture managed under equivalent conditions.
Mathematical formulation and component ratios
For a two-species system (such as a cereal crop interplanted with a timber or nut tree), the total LER is the sum of the partial LERs for each component:
LER = (Y_crop_poly / Y_crop_mono) + (Y_tree_poly / Y_tree_mono)
Where Y_crop_poly and Y_tree_poly represent the yields per unit of total system land area in the mixed agroforest, and Y_crop_mono and Y_tree_mono represent the yields of the same species grown as sole crops under identical management intensity.
Interpretation and critical evaluation
Students reviewing published LER values should examine three key methodological considerations:
- Threshold Assessment: An LER exceeding 1.0 indicates biological overyielding. For instance, an LER of 1.25 indicates that a monoculture enterprise would require twenty-five percent more land area to produce the same quantity of harvestable goods as the integrated system. This gain reflects resource complementarity, where species occupy distinct ecological niches.
- Partial LER Asymmetry: Total LER can obscure significant trade-offs. In many alley cropping trials, understory crop yield declines (partial LER under 1.0), but the loss is compensated by substantial tree growth or fruit production, driving the total LER above 1.0.
- Temporal Longevity: LER is not static. In early establishment years, when saplings cast minimal shade and have shallow roots, the crop partial LER may remain near 1.0. As tree canopies close, crop yields often decrease unless shade-tolerant cultivars are introduced or tree crowns are actively pruned.
Measuring soil organic carbon dynamics over time
Assessing whether agroforestry improves soil health requires precise quantification of Soil Organic Carbon (SOC) stocks over decadal timescales. Standard surface soil sampling fails to capture the true carbon sequestration mechanics of woody systems:
Depth-stratified sampling
Conventional agricultural soil tests sample only the top fifteen to thirty centimeters of the soil profile. However, tree root turnover and deep rhizodeposition introduce carbon deep into subsoil layers, frequently down to one meter or deeper. Rigorous research protocols mandate depth-stratified core sampling (e.g., 0–10 cm, 10–30 cm, 30–60 cm, and 60–100 cm) to account for subsoil carbon storage that remains resistant to microbial mineralization.
Bulk density corrections
Carbon concentration (expressed as grams of carbon per kilogram of soil) cannot be equated with total carbon stock without accounting for soil bulk density:
SOC Stock (Mg/ha) = Carbon Concentration * Bulk Density * Layer Thickness * (1 - Rock Fragment Fraction)
Because tree roots and organic matter deposition reduce soil compaction and lower bulk density over time, researchers calculate equivalent soil mass instead of relying on fixed-depth comparisons. Failing to correct for bulk density changes systematically miscalculates actual carbon sequestration.
Carbon fractionation
Advanced studies separate total organic carbon into functional fractions:
- Particulate Organic Carbon (POC): Fast-cycling, uncomplexed organic fragments sensitive to short-term management shifts.
- Mineral-Associated Organic Matter (MAOM): Carbon chemically bonded to silt and clay particles, representing durable, decadal-scale carbon stabilization.
Microclimatic and resource capture metrics
Beyond yield and soil carbon, agroforestry research evaluates the physical microclimate modifications generated by tree canopies:
Microclimate Parameter | Standard Measurement Tool | Agronomic Significance |
|---|---|---|
Photosynthetically Active Radiation (PAR) | Linear ceptometer bar across alley transects | Measures canopy light interception, transmission, and crop shade stress |
Vapor Pressure Deficit (VPD) | Aspirated psychrometers or digital hygrometers | Evaluates atmospheric drought stress and crop transpirational demand |
Soil Moisture Dynamics | Time-Domain Reflectometry (TDR) arrays | Tracks root water depletion zones and subsurface hydraulic redistribution |
Canopy Wind Attenuation | Sonic anemometer towers at multiple heights | Quantifies boundary-layer resistance and physical lodging protection |
In silvopasture systems, microclimatic monitoring is paired with livestock physiological metrics, measuring respiration rates and surface skin temperatures to quantify how shade canopies mitigate animal heat stress during extreme weather events.
Biodiversity and community ecological indices
Agroforestry literature frequently assesses whether integrated tree systems increase on-farm biodiversity compared to monocultural baselines. Researchers use standard ecological metrics:
- Species Richness (S): The absolute count of distinct species observed within designated sampling quadrants, pitfall traps, or bird point counts.
- Shannon-Wiener Diversity Index (H'): An information-statistic index that accounts for both species richness and relative abundance (evenness): H' = - SUM (p_i ln(p_i)) Where p_i is the proportion of total individuals belonging to the *i-th species. High index values indicate diverse, evenly distributed communities, whereas low values indicate monocultural dominance.
- Functional Diversity Indices: Beyond simple species counts, researchers categorize organisms by functional traits (such as predatory ground beetles, solitary wild pollinators, or arbuscular mycorrhizal fungi) to evaluate the delivery of specific ecosystem services across agroforestry systems.
A critical reading checklist for students
When reading peer-reviewed agroforestry literature, students should evaluate studies against four methodological criteria:
- Presence of True Monoculture Controls: Does the trial include identical sole-crop controls grown simultaneously on the same soil type under the same fertility regime?
- Longitudinal Duration: Was data collected over multiple consecutive seasons to capture weather variability and tree maturity transitions, or is the paper based on a single snapshot season?
- Spatial Transect Rigor: Were measurements taken across the full gradient from the tree trunk to the center of the alley, or did researchers sample only in a single unrepresentative location?
- Distinction Between Biological and Economic Yield: Does the paper distinguish total dry biomass from marketable, economically valued harvest?
At agripure, research literacy emphasizes that thorough data collection accounts for the trade-offs in multi-species farming. Understanding these analytical tools helps readers distinguish genuine ecological facilitation from resource competition in published literature.