Key takeaways
- USDA texture classifies only fine-earth mineral particles under 2.0 mm: Sand (2.0–0.05 mm), Silt (0.05–0.002 mm), and Clay (<0.002 mm); sieve out gravel and organic debris first.
- Match your line angle to the axis ticks: Clay runs horizontally across, Silt angles down-left, and Sand angles up-left from a base numbered right to left.
- Any two percentages fix your coordinate on the triangle; the third axis crosses the same dot to verify your math sums to 100%.
- Clay dominates soil behavior early: 27% clay enters clay loam, and 40% clay classifies a soil as pure clay.
- For an accurate mason jar settling test, add 1 teaspoon of Calgon (sodium hexametaphosphate) or low-sudsing detergent and mark layers at 40 seconds (sand), 2 hours (silt), and 24–48 hours (clay).
- Never add sand to clay—clay platelets pack between sand grains like mortar. Build soil structure instead with compost, mulch, cover crops, and minimal tillage.
Quick answer: To read the USDA soil texture triangle (sometimes called a soil pyramid), follow the slant of each edge's tick marks: trace Clay horizontally left to right, trace Silt diagonally down-left from the right edge, and trace Sand diagonally up-left from the right-to-left base. Because sand, silt, and clay always total 100%, any two percentages pinpoint your class among the 12 USDA soil textural classes—for instance, 40% sand, 40% silt, and 20% clay meet inside Loam.
What the USDA soil texture triangle measures (and what gets sieved out)
Soil texture measures the dry-weight percentages of three mineral particle sizes—sand, silt, and clay—in the fine-earth portion of your soil. The equilateral USDA soil texture triangle (often nicknamed a soil pyramid) converts those three numbers into one of 12 standardized soil textural classes.
Before running a lab hydrometer test or a home jar test, two fractions are excluded: coarse fragments larger than 2.0 mm (gravel, stones, pebbles) and organic matter (roots, mulch, humus). Labs pass air-dried samples through a 2 mm sieve and strip organic material first so the three axes represent 100% mineral fine earth. When gravel exceeds 15% by volume, USDA soil surveys attach a modifier (like gravelly loam) rather than altering the base class.
Particle size drives surface area, drainage, and nutrient holding. Scale a coarse sand grain up to a beach ball and a silt particle becomes a golf ball, while a clay platelet stays thinner than a sheet of paper. That surface-area leap explains why clay carries high Cation Exchange Capacity (CEC) compared with fast-leaching sand—covered alongside pH in our soil test report guide and Cooperative Extension soil testing guide.
USDA Fine-Earth Particle Separates (< 2.0 mm)
Separate | USDA Diameter | Wet Feel | Drainage & Pores | Water & Nutrient Holding |
|---|---|---|---|---|
Sand | 2.0 – 0.05 mm | Gritty; grains visible | Large macro-pores; fast drainage | Low available water; low CEC; rapid leaching |
Silt | 0.05 – 0.002 mm | Smooth, silky, floury | Medium pores; crusts if left bare | Highest plant-available water; moderate CEC |
Clay | < 0.002 mm | Sticky, plastic; hard dry | Tiny micro-pores; slow infiltration | High total moisture (tightly bound); high CEC |
How to read the soil texture triangle: the 3-axis angle rule
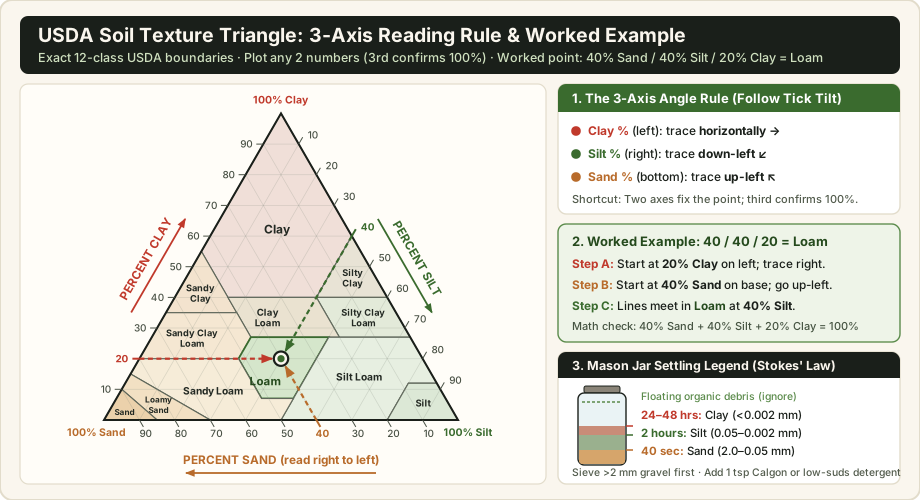
Beginners misread the triangle for one simple reason: at every perimeter tick mark, two interior gridlines angle away at 60 degrees. Tracing the wrong diagonal drops a productive sandy loam straight into heavy clay. Always match your trace direction to the printed tilt of the axis ticks:
- Percent Clay (Left Edge, 0% bottom to 100% top): Trace horizontally straight across from left to right, parallel to the base.
- Percent Silt (Right Edge, 0% top to 100% bottom): Trace diagonally down and to the left, parallel to the left clay edge.
- Percent Sand (Bottom Edge, 0% right to 100% left): Trace diagonally up and to the left, parallel to the right silt edge.
Watch the bottom sand axis closely: it increases right to left (0% sits at the bottom-right 100% silt corner; 100% sits at the bottom-left). Because sand + silt + clay always equals 100%, you only need two numbers to fix your dot. Follow the third axis out from that intersection as an instant audit—if it misses your third number, you traced the wrong diagonal or your percentages do not total 100%.
Three worked examples plotted step by step
- 40% Sand, 40% Silt, 20% Clay = Loam: Find 20 on the left clay edge and trace horizontally rightward. Locate 40 on the right-to-left bottom sand edge and trace diagonally up-left. The intersection sits squarely inside Loam, and tracing up-right along the silt grid confirms 40% silt.
- 65% Sand, 20% Silt, 15% Clay = Sandy Loam: Locate 15 on the left clay edge and move horizontally across. Find 65 on the bottom sand edge and angle up-left. The two lines meet inside Sandy Loam, confirmed by the 20% silt diagonal dropping down-left.
- 20% Sand, 35% Silt, 45% Clay = Clay: Start at 45 on the left clay edge and trace horizontally right. Start at 35 on the right silt edge and trace down-left. They cross well inside the upper Clay region, lined up with 20% sand rising up-left.
Note: When a sample lands directly on a black class border—such as 40% clay, 40% silt, and 20% sand—USDA Soil Survey conventions assign the finer, higher-clay class for drainage caution. In home beds, confirm border cases with the wet ribbon test.
All 12 USDA soil textural classes compared
The 12 USDA zones are deliberately asymmetric: pure Sand requires at least 85% sand, whereas Clay occupies nearly 30% of the chart starting at just 40% clay. Electrically charged clay platelets coat coarser grains and control stickiness and slow drainage long before reaching 50% by weight. Meanwhile, plant-available water capacity (moisture held loosely enough for roots between field capacity and wilting point) peaks in silt loams and loams rather than heavy clays, which lock much of their moisture too tightly for roots to extract.
Complete 12 USDA Soil Textural Classes Reference Matrix
Textural Class | Sand / Silt / Clay % | Drainage | Avail. Water (in/ft) | CEC (meq/100g) | Field Management Action |
|---|---|---|---|---|---|
Sand | 85–100 / 0–15 / 0–10 | Excessive; warms fast | 0.5–1.0 | 1–5 | Frequent drip watering; split nitrogen; annual compost & mulch |
Loamy Sand | 70–91 / 0–30 / 0–15 | Very fast | 0.9–1.3 | 3–8 | Winter cover crops to curb leaching; add leaf mold & compost |
Sandy Loam | 43–85 / 0–50 / 0–20 | Fast, reliable | 1.2–1.8 | 5–12 | Top vegetable tilth; top-dress 1–2 in compost annually |
Loam | 23–52 / 28–50 / 7–27 | Balanced | 1.8–2.3 | 10–18 | Protect crumb structure; limit tillage and keep soil mulched |
Silt Loam | 0–50 / 50–88 / 0–27 | Moderate | 2.0–2.6 | 12–22 | High fertility; keep mulched so rain does not seal the surface |
Silt | 0–20 / 80–100 / 0–12 | Slow if crusted | 2.2–2.6 | 10–18 | Avoid over-tilling fragile aggregates; keep permanent cover |
Sandy Clay Loam | 45–80 / 0–28 / 20–35 | Moderate | 1.5–2.0 | 12–20 | Work only when friable; add organic matter to curb hard setting |
Clay Loam | 20–45 / 15–53 / 27–40 | Slow-moderate | 1.8–2.2 | 15–28 | Fertile when uncompacted; use fixed paths and broadforking |
Silty Clay Loam | 0–20 / 40–73 / 27–40 | Slow | 1.9–2.4 | 18–30 | Stay off wet beds; pair autumn compost with deep cover crops |
Sandy Clay | 45–65 / 0–20 / 35–55 | Poor; dense dry | 1.4–1.8 | 18–28 | Build raised beds or add steady compost to form macro-pores |
Silty Clay | 0–20 / 40–60 / 40–60 | Very slow | 1.7–2.1 | 25–38 | Prioritize surface drainage, no-dig compost, wet-tolerant crops |
Clay | 0–45 / 0–40 / 40–100 | Very slow; shrink-swell | 1.4–1.9 | 25–50+ | Never till wet or add sand; use raised beds and thick mulch |
Pair your class with a quick drainage rate check via our soil percolation test guide, or match species to native texture using our guides to plants for heavy clay soil and resilient vegetables for sandy soil.
How to find your percentages at home: the mason jar settling test
The mason jar sedimentation test uses Stokes' Law—dense sand drops out of water in seconds while microscopic clay stays suspended for a day or more—to estimate your percentages for free. Two preparation steps determine accuracy: sieving out gravel and roots larger than 2 mm, and adding a real chemical dispersant.
In plain water, calcium and magnesium ions glue clay platelets into clumps (floccules) that sink in the first minute and read as false sand. Adding 1 teaspoon of Calgon water softener (sodium hexametaphosphate, standard in soil labs) or low-sudsing powdered dishwasher detergent replaces those bridges with sodium ions so particles repel each other and settle individually.
- Sample and dry: Mix 5 to 6 slices from 0 to 8 inches deep, discard mulch, and air-dry 2 cups on newspaper.
- Crush clods and sieve at 2 mm: Roll dry clods gently with a rolling pin without crushing pebbles, then sift through a 2 mm kitchen strainer or window screen.
- Load a straight-sided quart jar: Fill one-third full with sieved soil, top to three-quarters full with water, and add 1 teaspoon of Calgon or low-sudsing powdered dishwasher detergent.
- Shake for 2 to 3 minutes: Cap tightly and shake until zero soil sticks to the bottom. Set flat on a vibration-free counter and start a timer immediately.
- Mark Sand at 40 seconds: Draw a permanent-marker line at the settled sediment top at 40 seconds (some extension handouts round to 1 minute; Stokes' Law puts the 0.05 mm cutoff near 40 seconds).
- Mark Silt at 2 hours: Without jarring the glass, draw a second line at 2 hours. The band between 40 seconds and 2 hours is Silt.
- Mark Clay at 24 to 48 hours: Once the water clears noticeably (24–48+ hours), mark the final sediment top while ignoring floating organic bits. The band above the 2-hour line is Clay.
Exact ruler math from jar marks to triangle percentages
Measure straight up from the interior bottom in millimeters. Suppose total sediment height equals 60 mm, the 40-second sand line sits at 24 mm, and the 2-hour silt line sits at 48 mm:
- Sand % = (24 ÷ 60) × 100 = 40% Sand
- Silt % = ((48 − 24) ÷ 60) × 100 = 40% Silt
- Clay % = ((60 − 48) ÷ 60) × 100 = 20% Clay (plots squarely in Loam)
Because the USDA triangle measures dry weight while a jar measures wet settled volume—and wet clay swells slightly—jar readings commonly over-read clay by 3 to 5 percentage points. For full troubleshooting, see our mason jar soil texture test walkthrough or learn how to read a laboratory soil test.
Fast field verification: the USDA NRCS texture-by-feel ribbon test
Cross-check any borderline jar test in two minutes using the USDA NRCS Guide to Texture by Feel (adapted from S.J. Thien's 1979 flowchart). Knead about 25 grams (a golf-ball pinch) of pebble-free soil with water drop by drop until it feels like moist putty. Try forming a ball, then squeeze a 2–3 mm ribbon upward between thumb and forefinger until it breaks under its own weight. Finally, wet a small pinch in your palm and rub with a fingertip to test gritty (sand) versus floury-smooth (silt) feel.
USDA NRCS Texture-by-Feel Decision Matrix
Ball & Ribbon Result | Very Gritty (Sand) | Balanced Feel | Very Smooth / Floury (Silt) |
|---|---|---|---|
Will not hold a ball | Sand | — | — |
Weak ball, no ribbon | Loamy Sand | — | — |
Weak ribbon (< 1 inch) | Sandy Loam | Loam | Silt Loam (Silt if buttery) |
Medium ribbon (1–2 inches) | Sandy Clay Loam | Clay Loam | Silty Clay Loam |
Strong ribbon (> 2 inches) | Sandy Clay | Clay | Silty Clay |
Why you cannot change field soil texture (and how to fix structure instead)
After plotting a heavy Clay or dry Sand, many growers want to truck in the missing mineral to push their dot toward Loam. In open ground, shifting a 1,000-square-foot bed 8 inches deep from 45% clay to 20% clay requires hauling and blending roughly 15 to 20 cubic yards of pure coarse sand—more than 20 tons—just to alter one spade depth.
Note: Adding modest amounts of sand to clay creates dense, concrete-like compaction. Microscopic clay platelets slip right into the voids between sand grains just as Portland cement binds aggregate into mortar, cutting total pore space and making drainage worse.
Texture is permanent geology, but soil structure—how roots, fungi, earthworms, and biological glues like glomalin cluster particles into crumbly aggregates—responds directly to management. Well-structured clay drains rainwater briskly between crumbs while keeping its natural mineral fertility.
- Clays & Clay Loams: Top-dress 1–2 inches of finished compost yearly, stay off wet beds (digging wet clay smears pores into hardpan), loosen subsoil with a broadfork, and sow deep-tapping tillage radish or red clover. Apply gypsum only if a lab confirms high sodium—see gypsum for compacted and sodic clay soil, amending heavy clay soil, and cover crops and broadforking.
- Sands & Loamy Sands: Add compost and leaf mold across multiple seasons (track progress with reading soil organic-carbon numbers), keep 3–4 inches of organic mulch over bare soil, irrigate via drip lines, and grow loose-soil favorites like carrots and potatoes.
- Silts & Silt Loams: Prevent raindrop crusting on bare beds with permanent straw or leaf mulch and seasonal rotations from our home garden cover crops guide.