Key takeaways
- Match phosphorus extractants to soil pH: Bray P1 falsely reads low on calcareous soils above pH 7.2, where Olsen (0.5 M NaHCO3) is required; Mehlich-3 covers acidic-to-neutral soils across most US university labs.
- Active soil pH (1:1 water) shows whether acidity needs correction, whereas Buffer pH (Sikora, Modified Mehlich, or SMP) measures stored reserve acidity so the lab can size your exact lime rate—lower buffer pH means more lime.
- Read CEC (3–8 meq/100g sand, 12–25 loam, 25+ clay/organic) as your soil's cation fuel tank and skip costly Albrecht base-saturation ratio chasing; land-grant trials favor nutrient sufficiency ppm and target pH.
- Avoid the raised-bed over-composting trap: pushing organic matter above 10–12% and Mehlich-3 P past 100 ppm locks out zinc and iron, spikes soluble salts (EC > 2.0 dS/m), and triggers dissolved phosphorus runoff.
- Convert lab ppm accurately (ppm × 2 = lb/acre; lb/acre × 0.367 = oz/100 sq ft) and collect 10–15 zigzag cores in a clean plastic bucket—galvanized metal buckets leach artificial zinc spikes into moist samples.
Quick answer: To read any US soil test report accurately, always check the laboratory extraction method and pH first before looking at individual nutrient numbers. Soil pH governs nutrient solubility (6.0–7.0 suits most vegetables), while Buffer pH (Sikora, Modified Mehlich, or SMP) tells you how many pounds of lime are needed to overcome reserve acidity in clay and organic soils. On calcareous soils above pH 7.2, insist on the Olsen phosphorus test—Bray P1 falsely reads low when free calcium carbonate neutralizes its acid. Use CEC (3–8 meq/100g sand, 12–25 loam, 25+ clay) to pace fertilizer frequency, watch for raised beds exceeding 10–12% organic matter and 100 ppm phosphorus (which lock up zinc and leach runoff), convert ppm × 2 to lb/acre (× 0.367 for oz/100 sq ft), and collect cores strictly in a clean plastic bucket—never galvanized metal.
Why One Soil Report Reads Differently Across US Labs
Opening a PDF from a Cooperative Extension or commercial soil lab often trips gardeners up because raw numbers from Pennsylvania, Ohio, Iowa, and Arizona cannot be compared one-for-one. A reading of 25 ppm phosphorus looks low on one regional sheet, optimum on a second, and completely misleading on a third if the laboratory ran the wrong chemical extractant for your soil's pH. Decoding any US report starts with matching the laboratory method printed in the column header to your native soil chemistry, a principle echoed in our Cooperative Extension testing guide and lab report walkthrough.
Whether you garden in weathered acidic red clay across the Southeast, cool silt loam in the Midwest, or limestone-rich desert caliche in the Southwest, four core numbers anchor every sound amendment decision: Active vs. Buffer pH, Phosphorus Extractant Method, Cation Exchange Capacity (CEC), and Organic Matter percentage (OM%). Reading those four lines in order prevents the two costliest backyard mistakes—dumping unneeded phosphate onto already loaded beds or wasting sulfur and lime at blind rates.
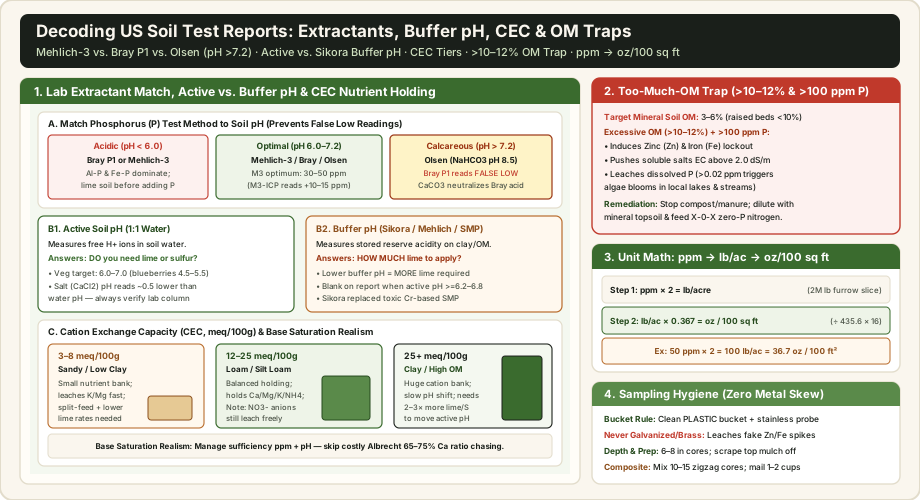
Phosphorus Extractants (Mehlich-3 vs. Bray P1 vs. Olsen) & Active vs. Buffer pH
Labs do not measure total phosphorus locked inside rock minerals; they wash a weighed soil core with a calibrated chemical solution to mimic what roots can draw over one growing season. Because acidic eastern soils bind phosphorus to iron and aluminum oxides while alkaline western soils lock phosphorus inside calcium carbonates, USDA Natural Resources Conservation Service (NRCS) and land-grant soil labs rely on three distinct P extractants.
Major US Soil Test Phosphorus Extractants & pH/Buffer Lab Methods
Lab Test Parameter | Target Soil pH / Region | What It Measures & Optimum Band | Critical Lab Trap to Catch |
|---|---|---|---|
Mehlich-3 Phosphorus (Colorimetric vs. ICP) | Acidic to neutral (pH < 7.2); Midwest, South, Mid-Atlantic | Multi-element acid + EDTA extractant; 30–50 ppm optimum (colorimetric) | Mehlich-3 ICP reads 10–15 ppm higher than colorimetric M3 by including organic P; check which detector your lab uses |
Bray P1 (Bray-Kurtz 1) | Acidic to neutral (pH < 7.2–7.4); traditional Midwest | Dilute HCl + NH4F targeting Al-P and Fe-P; 20–30 ppm optimum (Bray × 1.35 ≈ M3) | Falsely reads LOW on calcareous soils (pH > 7.2) because free CaCO3 neutralizes the dilute acid and precipitates fluoride |
Olsen Phosphorus (0.5 M NaHCO3, pH 8.5) | Calcareous / alkaline (pH > 7.2); Western, Plains, Southwest US | Sodium bicarbonate precipitates free Ca to release Ca-P; 12–18+ ppm optimum | Numbers run far lower numerically than Mehlich-3—never apply a Bray/M3 chart to an Olsen reading |
Active Soil pH (1:1 Water vs. CaCl2 Salt) | All US soils; first decision gate on any report | Free H+ ions in soil solution; 6.0–7.0 ideal for most crops (4.5–5.5 blueberries) | 1:1 CaCl2 salt pH reads ~0.5 units lower than water pH; check column labels before liming |
Buffer pH (Sikora, Modified Mehlich, SMP) | Reported only when active pH falls below ~6.2–6.8 | Reserve H+ and Al3+ bound to clay and organic matter; sets exact lime tonnage | Lower buffer pH = MORE lime required; blank buffer row usually means soil pH is already high enough that no lime is needed |
Why Bray P1 fails on calcareous alkaline soils (pH > 7.2)
Gardeners in Utah, Colorado, Arizona, West Texas, and parts of the Great Plains frequently receive baffling reports showing near-zero phosphorus even in fertile beds. When an out-of-state lab automatically runs Bray P1 on soil containing free calcium carbonate above pH 7.2, carbonate minerals neutralize the dilute hydrochloric acid and bind the fluoride reagent before it can extract plant-available P. Switching to the Olsen sodium bicarbonate test resolves the error immediately, showing true plant-available calcium-phosphates—critical context alongside our alkaline soil gardening guide and western iron chlorosis guide.
Active pH vs. Sikora, Modified Mehlich & SMP Buffer pH
Think of Active Soil pH (`1:1` water slurry) as the air temperature inside a room, and Buffer pH as the insulation thickness in the walls. Active pH decides whether you need agricultural lime or elemental sulfur to release nutrients shown on our soil pH nutrient availability chart. Below pH 5.5, soluble aluminum damages roots of beets and cabbage; above pH 7.5, iron, manganese, and zinc precipitate out of reach for tomatoes and spinach—though acid-loving crops like potatoes (pH 5.2–6.0 to suppress scab) and blueberries deliberately run lower.
Buffer pH answers the volume question: how many pounds of lime per 1,000 square feet are required to move active pH to target. Most Midwest and Southern extension labs have replaced the legacy SMP buffer (which contained hazardous chromium) with the non-toxic Sikora buffer, while Pennsylvania and Maine run Modified Mehlich buffer. Remember the counterintuitive reading rule: the lower the buffer pH number, the greater the reserve acidity held on clay and organic matter, and the more lime you must apply. If a sandy soil (low buffer capacity) and a heavy clay loam both read active pH 5.4, the clay soil may need two to three times as much lime to reach pH 6.5. When active pH already sits above 6.2 to 6.8, labs leave Buffer pH blank because zero lime is needed.
CEC Tiers, Base Saturation Realism & The Over-Composted OM Trap
Cation Exchange Capacity (CEC), reported in milliequivalents per 100 grams (`meq/100g` or `cmol/kg`), measures the total negatively charged binding sites sitting on clay platelets and stable soil humus. Those magnetic sites hold positively charged nutrient cations—calcium (`Ca2+`), magnesium (`Mg2+`), potassium (`K+`), and ammonium (`NH4+`)—and keep them from washing past roots during spring storms. Note that nitrate (`NO3-`) and sulfate (`SO4^2-`) carry negative charges, meaning even a high-CEC clay cannot retain nitrate against heavy leaching.
CEC Textural Tiers, Organic Matter Benchmarks & Raised-Bed Remediation Rules
Soil Class / Profile | Typical CEC (meq/100g) | Target Organic Matter (%) | Fertilizing & Amendment Strategy |
|---|---|---|---|
Sand / Loamy Sand (Coastal Plain, Florida) | 3–8 meq/100g | 2.5–4.5% (hard to build high) | Small nutrient tank; spoon-feed K and N in split doses; build active OM annually with compost and cover crops |
Loam / Silt Loam (Midwest, Piedmont) | 12–25 meq/100g | 3.5–6.0% ideal mineral balance | Stable nutrient exchange; apply maintenance amendments only where Mehlich-3 or Olsen ratings drop below Optimum |
Heavy Clay / Muck Soils | 25–40+ meq/100g | 4.0–8.0% (native high-OM mucks higher) | Huge reserve tank; requires 2–3× more lime or elemental sulfur to shift pH; focus on structural drainage and aeration |
Over-Composted Raised Bed Trap | 25–50+ meq/100g (often inflated by Ca) | >10–12% OM + >100 ppm Mehlich-3 P | STOP all compost, bone meal, and manure; feed zero-P nitrogen (X-0-X), dilute with mineral topsoil, monitor EC < 2.0 dS/m |
Base saturation realism: skip chasing Albrecht ratio percentages
Commercial lab reports often print Percent Base Saturation (%BS)—the share of CEC sites occupied by Ca, Mg, K, and Na—alongside marketing claims pushing an "ideal" Albrecht ratio (65–75% Ca, 10–15% Mg, 3–5% K). Decades of replicated field trials across Iowa State, Cornell, Purdue, and Michigan State demonstrate that crops thrive across wide cation ratios so long as individual nutrients exceed critical sufficiency ppm and soil pH sits in range. Trying to force a high-Mg soil into a strict Ca:Mg ratio with unnecessary gypsum or specialty lime wastes money without lifting yields—save gypsum strictly for verified sodic soils (`% Na > 15%` or high ESP), and verify real texture classes with our soil texture triangle guide.
Warning — The >10–12% Organic Matter & >100 ppm Phosphorus Trap: Backyard raised beds topped off year after year with bagged steer manure, mushroom compost, or poultry compost regularly climb past 10–12% organic matter and push Mehlich-3 phosphorus above 100–250+ ppm (double to five times the 30–50 ppm agronomic optimum cited by Penn State and OSU). Unlike nitrogen, excess phosphorus stays locked in place, directly inducing zinc (Zn) and iron (Fe) lockout (interveinal leaf chlorosis even when soil Zn reads adequate), raising soluble salts above 2.0 dS/m (burning tender seedlings), and leaching dissolved P into storm drains—where USDA NRCS notes as little as 0.02 ppm fuels freshwater algal blooms. To recover an over-composted bed, stop adding compost or manure for 2–3 years, dilute pure-compost frames down toward ~70% mineral topsoil / 30% organic material, use zero-P fertilizers (blood meal, feather meal, or urea `X-0-0`), and cycle nutrients with winter cover crops like red clover and hairy vetch.
Exact Soil Lab Unit Conversions (ppm → lb/acre → oz/100 sq ft)
University labs report extracted nutrients in parts per million (`ppm`) or pounds per acre (`lb/acre`), yet backyard beds are measured in 100-square-foot sections. Standard US soil testing assumes a 6- to 6.67-inch plow slice across one acre weighs roughly 2,000,000 pounds, creating a clean two-step conversion chain from lab report numbers down to your kitchen scale.
Soil Test Report Conversion Formulas for Backyard Beds & Commercial Bags
Conversion Step | Exact Multiplier Formula | Worked Garden Example | Practical Field Note |
|---|---|---|---|
ppm → lb/acre (6.7 in furrow slice) | ppm × 2 = lb/acre | 50 ppm K × 2 = 100 lb K/acre | Assumes standard ~1.3 g/cm3 mineral soil density; high-OM raised beds are lighter per depth |
lb/acre → oz/100 sq ft | lb/acre × 0.367 = oz/100 sq ft | 100 lb/acre × 0.367 = 36.7 oz/100 sq ft | Derived from (100 ÷ 43,560 sq ft/acre) × 16 oz/lb = 0.0367 × 10 = 0.367 |
lb/acre → lb/1,000 sq ft | lb/acre × 0.023 = lb/1,000 sq ft | 100 lb/acre × 0.023 = 2.3 lb/1,000 sq ft | Matches most homeowner lime and extension fertilizer recommendation tables |
Elemental P → Fertilizer P2O5 | Elemental P × 2.29 = P2O5 | 20 lb P × 2.29 = 45.8 lb P2O5 | Fertilizer bags list middle number as % P2O5, never pure elemental P |
Elemental K → Fertilizer K2O | Elemental K × 1.20 = K2O | 40 lb K × 1.20 = 48.0 lb K2O | Divide required lb P2O5 or K2O by decimal bag % (e.g. ÷ 0.50 for 0-0-50 sulfate of potash) |
Work through one real raised-bed example before buying amendments. Suppose your report recommends 1.5 lb of actual nitrogen per 1,000 sq ft on a bed that already reads 95 ppm Mehlich-3 phosphorus (`Very High`, meaning zero bone meal or manure). On a 100 sq ft bed (`4 × 25 ft`), you need `1.5 × (100 ÷ 1,000) = 0.15 lb` (`2.4 oz`) of actual N. Using `12-0-0` blood meal (`0.12` N), divide `2.4 oz ÷ 0.12 = 20 oz` (`1.25 lb`) spread across that 100 sq ft frame. Apply the same proportion math when reading fertilizer rates or checking manure application caps.
Sampling Hygiene: Why Galvanized Buckets Ruin Lab Reports
Even an accredited North American Proficiency Testing (NAPT) laboratory cannot rescue a contaminated or skewed soil sample. Ohio State University Extension (HYG-1132) and the University of Georgia Soil Test Handbook specifically warn growers away from galvanized steel buckets, brass screens, and rusted iron trowels. Zinc plating on galvanized pails leaches directly into damp, slightly acidic soil during mixing, creating an artificial zinc spike on your report that masks genuine zinc deficiency or triggers false heavy-metal alarms—while rusted iron tools skew extractable Fe.
- Use a clean plastic bucket and stainless probe: Rinse a food-grade or dedicated plastic pail completely free of old fertilizer dust or soap residue, and pair it with a stainless-steel soil probe or clean stainless garden trowel.
- Separate zones by management history: Pull separate composite bags for native in-ground beds, composted raised beds, orchards, and turfgrass; mixing high-OM raised bed soil with sandy lawn dirt renders both reports useless.
- Scrape surface litter and core to root depth: Brush away mulch, bark, and grass thatch, then take 10 to 15 random zigzag cores down to 6–8 inches for vegetable beds (4–5 inches under established turf) as detailed in our accurate soil sampling guide.
- Air-dry cleanly without artificial heat: Break up clods inside the plastic bucket, pick out pebbles and fresh root fragments, air-dry moist soil on clean brown kraft paper at room temperature (never bake in an oven, which alters extractable K and N), and pack 1 to 2 cups into the lab bag.
Plan routine retesting every 2 to 3 years on low-CEC sandy soils and every 3 to 4 years on buffered loams and clays, sampling 3 to 6 months ahead of spring planting so autumn lime has time to neutralize reserve acidity. Combine your lab scorecard with our soil test action plan, decoding report numbers guide, and raised-bed cover cropping workflow to keep carrots, brassicas, and fruiting crops productive without over-applying nutrients.